Grundlæggende statistik
| Institutionelle ejere | 292 total, 290 long only, 0 short only, 2 long/short - change of -12,50% MRQ |
| Gennemsnitlig porteføljeallokering | 0.1088 % - change of -84,20% MRQ |
| Institutionelle aktier (lange) | 20.496.204 (ex 13D/G) - change of -2,85MM shares -9,18% MRQ |
| Institutionel værdi (lang) | $ 652.888 USD ($1000) |
Institutionelt ejerskab og aktionærer
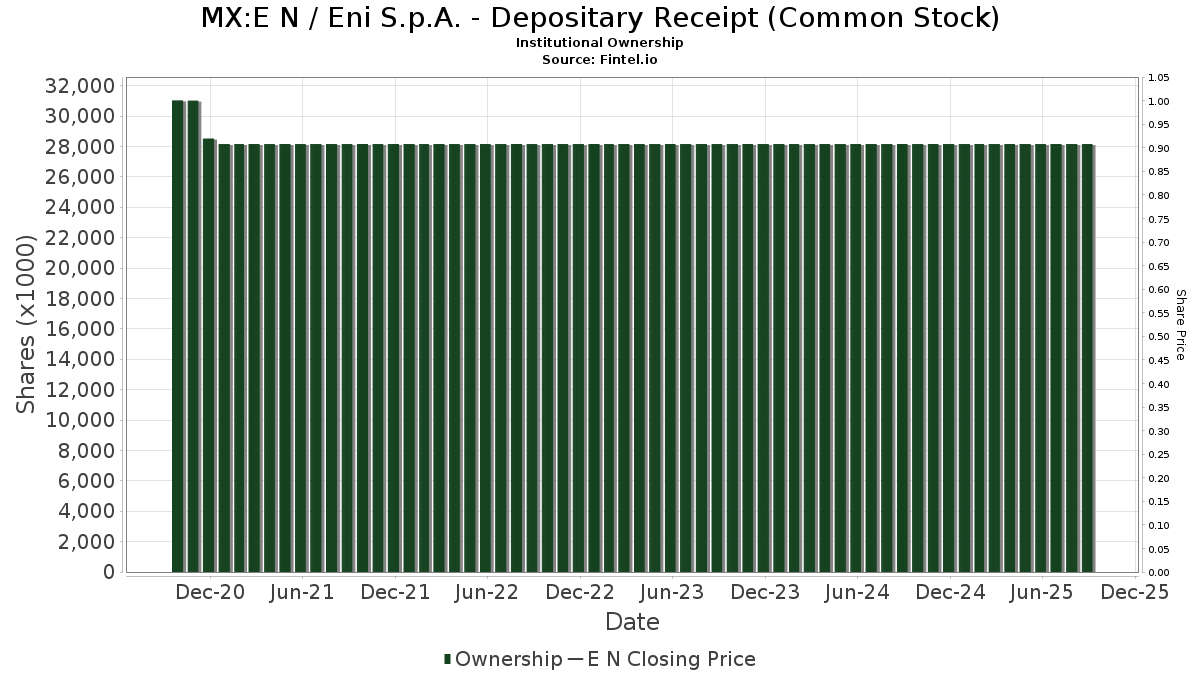
Eni S.p.A. - Depositary Receipt (Common Stock) (MX:E N) har 292 institutionelle ejere og aktionærer, der har indsendt 13D/G- eller 13F-formularer til Securities Exchange Commission (SEC). Disse institutioner har i alt 20,496,204 aktier. Største aktionærer omfatter Natixis Advisors, L.p., Morgan Stanley, Goldman Sachs Group Inc, BlackRock, Inc., Northern Trust Corp, Bank Of America Corp /de/, American Century Companies Inc, Fmr Llc, Massachusetts Financial Services Co /ma/, and Raymond James Financial Inc .
Eni S.p.A. - Depositary Receipt (Common Stock) (BMV:E N) institutionel ejerskabsstruktur viser aktuelle positioner i virksomheden efter institutioner og fonde, samt seneste ændringer i positionsstørrelse. Større aktionærer kan omfatte individuelle investorer, investeringsforeninger, hedgefonde eller institutioner. Skema 13D angiver, at investoren besidder (eller besidder) mere end 5 % af virksomheden og har til hensigt (eller har til hensigt at) aktivt at forfølge en ændring i forretningsstrategi. Skema 13G indikerer en passiv investering på over 5%.
Fondens stemningsscore
Fund Sentiment Score (fka Ownership Accumulation Score) finder de aktier, der bliver mest købt af fonde. Det er resultatet af en sofistikeret, multi-faktor kvantitativ model, der identificerer virksomheder med de højeste niveauer af institutionel akkumulering. Scoringsmodellen bruger en kombination af den samlede stigning i oplyste ejere, ændringerne i porteføljeallokeringer i disse ejere og andre målinger. Tallet går fra 0 til 100, hvor højere tal indikerer et højere niveau af akkumulering for sine jævnaldrende, og 50 er gennemsnittet.
Opdateringsfrekvens: Dagligt
Se Ownership Explorer, som giver en liste over højest rangerende virksomheder.
AI+ Ask Fintel’s AI assistant about Eni S.p.A. - Depositary Receipt (Common Stock).
Select a question to share a public post with an AI-crafted answer.
Thinking of good questions…
13F og NPORT arkivering
Detaljer om 13F-arkivering er gratis. Detaljer om NP-ansøgninger kræver et premium-medlemskab. Grønne rækker angiver nye positioner. Røde rækker angiver lukkede positioner. Klik på linket ikon for at se den fulde transaktionshistorik.
Opgrader
for at låse premium-data op og eksportere til Excel ![]() .
.
| Fil dato | Kilde | Investor | Type | Gennemsnitlig pris (Øst) |
Aktier | Δ Aktier (%) |
Rapporteret Værdi ($1000) |
Δ Værdi (%) |
Port Alloc (%) |
|
|---|---|---|---|---|---|---|---|---|---|---|
| 2026-02-13 | 13F | Palisade Asset Management, LLC | 0 | -100,00 | 0 | |||||
| 2026-02-06 | 13F | Plan A Wealth LLC | 5.582 | 212 | ||||||
| 2026-02-13 | 13F | Flow Traders U.s. Llc | 15.898 | 74,30 | 1 | |||||
| 2026-04-21 | 13F | Venturi Wealth Management, LLC | 7.991 | 6,85 | 452 | 59,72 | ||||
| 2026-01-27 | 13F | Elevated Capital Advisors, LLC | 18 | 1 | ||||||
| 2026-02-11 | 13F | Jpmorgan Chase & Co | 115.808 | 66,98 | 4.394 | 81,30 | ||||
| 2026-01-12 | 13F | World Equity Group, Inc. | 0 | -100,00 | 0 | |||||
| 2026-01-28 | 13F | Barrett & Company, Inc. | 325 | 0,00 | 12 | 9,09 | ||||
| 2026-02-02 | 13F | Montag A & Associates Inc | 144 | -46,67 | 5 | -44,44 | ||||
| 2026-02-17 | 13F | Ancora Advisors, LLC | 177 | 7 | ||||||
| 2026-02-09 | 13F | Mondrian Investment Partners LTD | 271 | 0,00 | 10 | 11,11 | ||||
| 2026-02-05 | 13F | Gabelli Funds Llc | 130.000 | 0,00 | 4.932 | 8,56 | ||||
| 2026-04-02 | 13F | Hilltop National Bank | 3.191 | -18,76 | 181 | 20,81 | ||||
| 2026-02-17 | 13F | Russell Investments Group, Ltd. | 28.970 | 52,33 | 1.099 | 65,51 | ||||
| 2026-02-09 | 13F | Smithfield Trust Co | 104 | 0 | ||||||
| 2026-02-11 | 13F | Group One Trading, L.p. | Call | 200 | -33,33 | 8 | -30,00 | |||
| 2025-11-13 | 13F | BW Gestao de Investimentos Ltda. | 0 | -100,00 | 0 | |||||
| 2026-02-11 | 13F | Group One Trading, L.p. | 100 | -50,00 | 4 | -50,00 | ||||
| 2026-02-02 | 13F | Cornerstone Planning Group LLC | 143 | 17,21 | 6 | 25,00 | ||||
| 2026-02-10 | 13F | Savant Capital, LLC | 17.938 | 7,23 | 681 | 16,44 | ||||
| 2026-04-13 | 13F | St Germain D J Co Inc | 0 | -100,00 | 0 | |||||
| 2026-02-06 | 13F | EverSource Wealth Advisors, LLC | 7.191 | -1,03 | 273 | 7,51 | ||||
| 2026-01-23 | 13F | Rsm Us Wealth Management Llc | 11.143 | 1,08 | 425 | 8,44 | ||||
| 2026-02-12 | 13F | XY Capital Ltd | 0 | -100,00 | 0 | |||||
| 2026-01-27 | 13F | TD Waterhouse Canada Inc. | 505 | 0,00 | 19 | 11,76 | ||||
| 2026-02-17 | 13F | Dv Equities, Llc | 926 | 35 | ||||||
| 2026-02-18 | 13F | GWM Advisors LLC | 0 | -100,00 | 0 | |||||
| 2026-02-17 | 13F | Qube Research & Technologies Ltd | 92.839 | 456,99 | 3.522 | 505,15 | ||||
| 2026-02-17 | 13F | Susquehanna International Group, Llp | 20.177 | 55,20 | 766 | 68,50 | ||||
| 2026-02-17 | 13F | Susquehanna International Group, Llp | Put | 49.800 | 194,67 | 1.889 | 220,17 | |||
| 2026-02-17 | 13F | Susquehanna International Group, Llp | Call | 12.100 | -79,39 | 459 | -77,62 | |||
| 2026-04-10 | 13F | Armstrong Advisory Group, Inc | 43 | 0,00 | 2 | 100,00 | ||||
| 2026-02-03 | 13F | Sequoia Financial Advisors, LLC | 33.351 | 8,17 | 1.265 | 17,46 | ||||
| 2026-04-22 | 13F | Larry Mathis Financial Planning, LLC | 7.016 | -0,75 | 397 | 48,13 | ||||
| 2026-02-06 | 13F | Global Retirement Partners, LLC | 1.375 | 320,49 | 52 | 372,73 | ||||
| 2026-02-09 | 13F | Integrity Alliance, Llc. | 0 | -100,00 | 0 | |||||
| 2026-02-17 | 13F | Citadel Advisors Llc | Put | 42.000 | 225,58 | 1.593 | 254,00 | |||
| 2026-02-17 | 13F | Citadel Advisors Llc | Call | 14.100 | -29,50 | 535 | -23,61 | |||
| 2026-02-05 | 13F | AlphaCore Capital LLC | 21.931 | -12,67 | 832 | -6,73 | ||||
| 2026-02-06 | 13F | Flynn Zito Capital Management, Llc | 7.553 | 0,45 | 287 | 9,16 | ||||
| 2026-02-11 | 13F | Parallel Advisors, LLC | 6.948 | 0,01 | 264 | 8,68 | ||||
| 2026-02-10 | 13F | Bank of New York Mellon Corp | 61.906 | 19,99 | 2.349 | 30,23 | ||||
| 2025-11-20 | 13F | Asset Dedication, LLC | 0 | -100,00 | 0 | |||||
| 2026-02-13 | 13F | Pathstone Holdings, LLC | 36.061 | 2,20 | 1.368 | 10,86 | ||||
| 2026-02-17 | 13F | Guggenheim Capital Llc | 26.291 | 9,88 | 997 | 19,26 | ||||
| 2025-11-14 | 13F | Tower Research Capital LLC (TRC) | 0 | -100,00 | 0 | |||||
| 2026-04-23 | 13F | SJS Investment Consulting Inc. | 83 | 50,91 | 5 | 100,00 | ||||
| 2026-04-07 | 13F | Retirement Wealth Solutions LLC | 188 | 132,10 | 11 | 233,33 | ||||
| 2026-02-13 | 13F | Neuberger Berman Group LLC | 42.934 | 46,85 | 1.629 | 59,45 | ||||
| 2026-02-11 | 13F | IMA Wealth, Inc. | 88 | 3 | ||||||
| 2026-02-12 | 13F | Ci Investments Inc. | 184.863 | -7,24 | 7.014 | 116.783,33 | ||||
| 2026-02-12 | 13F | Barometer Capital Management Inc. | 0 | -100,00 | 0 | |||||
| 2026-04-14 | 13F | Congress Park Capital LLC | 6.600 | 0,00 | 374 | 49,20 | ||||
| 2026-02-17 | 13F | Laird Norton Trust Company, Llc | 28.603 | 1.085 | ||||||
| 2026-02-13 | 13F | Citigroup Inc | 1.561 | -32,48 | 59 | -26,25 | ||||
| 2026-02-04 | 13F | Purkiss Capital Advisors LLC | 18.340 | 696 | ||||||
| 2026-02-06 | 13F | Vestmark Advisory Solutions, Inc. | 0 | -100,00 | 0 | |||||
| 2026-04-02 | 13F | Ares Financial Consulting, LLC | 477 | 26 | ||||||
| 2026-02-17 | 13F | Advisory Services Network, LLC | 0 | -100,00 | 0 | |||||
| 2026-02-13 | 13F | Toroso Investments, LLC | 26.684 | 6,08 | 1.012 | 15,13 | ||||
| 2026-02-13 | 13F | Wells Fargo & Company/mn | 248.098 | -8,98 | 9.413 | -1,20 | ||||
| 2026-01-15 | 13F | Nisa Investment Advisors, Llc | 1.642 | 9,47 | 62 | 16,98 | ||||
| 2026-02-13 | 13F | Atlas Capital Advisors Llc | 5.991 | 47,13 | 227 | 71,97 | ||||
| 2026-02-12 | 13F | Brown Brothers Harriman & Co | 508 | 19 | ||||||
| 2026-02-06 | 13F | Bare Financial Services, Inc | 250 | 0,00 | 9 | 12,50 | ||||
| 2026-04-07 | 13F | CoreCap Advisors, LLC | 5.217 | 627,62 | 295 | 992,59 | ||||
| 2026-02-17 | 13F | Royal Bank Of Canada | Call | 1.200 | 46 | |||||
| 2026-02-17 | 13F | Royal Bank Of Canada | 56.125 | -30,83 | 2.129 | -24,96 | ||||
| 2026-02-04 | 13F | MONECO Advisors, LLC | 74.348 | 2.821 | ||||||
| 2026-04-13 | 13F | Plan Group Financial, LLC | 8.500 | 481 | ||||||
| 2026-02-06 | 13F | Pnc Financial Services Group, Inc. | 35.354 | 0,30 | 1.341 | 8,94 | ||||
| 2026-04-13 | 13F | IFP Advisors, Inc | 312 | -5,45 | 18 | 41,67 | ||||
| 2026-02-13 | 13F | LFG Wealth Partners, LLC | 78.414 | 2.975 | ||||||
| 2026-02-17 | 13F | Abel Hall, LLC | 7.236 | 275 | ||||||
| 2026-02-13 | 13F | Barclays Plc | 0 | -100,00 | 0 | |||||
| 2026-02-13 | 13F | Parkside Financial Bank & Trust | 632 | 0,00 | 24 | 4,55 | ||||
| 2025-10-29 | 13F | Inspire Advisors, LLC | Call | 0 | -100,00 | 0 | -100,00 | |||
| 2026-04-24 | 13F | Root Financial Partners, LLC | 259 | 115,83 | 15 | 250,00 | ||||
| 2026-02-13 | 13F | State Street Corp | 100.706 | -51,89 | 3.831 | -48,40 | ||||
| 2026-02-19 | 13F | Atomi Financial Group, Inc. | 10.667 | 7,28 | 405 | 16,43 | ||||
| 2026-04-09 | 13F | Moody National Bank Trust Division | 7.050 | 13,13 | 399 | 69,07 | ||||
| 2026-02-02 | 13F | Kornitzer Capital Management Inc /ks | 9.875 | 375 | ||||||
| 2026-01-30 | 13F | American Capital Advisory, LLC | 13 | 62,50 | 0 | |||||
| 2026-02-17 | 13F | Advisor Group Holdings, Inc. | 19.467 | 14,72 | 739 | 23,21 | ||||
| 2026-04-07 | 13F | U.S. Capital Wealth Advisors, LLC | 14.890 | 3,52 | 843 | 54,50 | ||||
| 2026-02-12 | 13F | Hrt Financial Lp | 9.867 | 0 | ||||||
| 2026-02-10 | 13F | Principia Wealth Advisory, LLC | 53 | 0,00 | 2 | 100,00 | ||||
| 2026-02-12 | 13F | Advisors Asset Management, Inc. | 52.540 | -16,50 | 1.993 | -9,37 | ||||
| 2026-02-13 | 13F | Marshall Wace, Llp | 0 | -100,00 | 0 | |||||
| 2026-02-17 | 13F | Citadel Advisors Llc | 0 | -100,00 | 0 | |||||
| 2026-02-10 | 13F | Dynasty Wealth Management, Llc | 26.362 | 4,85 | 1.000 | 13,90 | ||||
| 2026-02-17 | 13F | Aquatic Capital Management LLC | 0 | -100,00 | 0 | |||||
| 2026-02-17 | 13F | Quantinno Capital Management LP | 401.039 | 35,18 | 15.215 | 46,75 | ||||
| 2026-04-14 | 13F | Seven Mile Advisory | 4.275 | 242 | ||||||
| 2026-02-11 | 13F | O'shaughnessy Asset Management, Llc | 171.326 | 63,78 | 6.500 | 77,79 | ||||
| 2026-02-26 | 13F | TD Capital Management LLC | 200 | 0,00 | 8 | 16,67 | ||||
| 2026-02-17 | 13F | Balyasny Asset Management Llc | 15.050 | 571 | ||||||
| 2026-02-13 | 13F | Sei Investments Co | 11.807 | 8,69 | 448 | 17,94 | ||||
| 2026-04-06 | 13F | Versant Capital Management, Inc | 13.818 | 12,79 | 782 | 68,53 | ||||
| 2026-02-04 | 13F | BCJ Capital Management, LLC | 6.150 | -94,79 | 233 | -94,35 | ||||
| 2026-04-16 | 13F | SG Americas Securities, LLC | 2.651 | -5,99 | 0 | |||||
| 2026-01-29 | 13F | Sanctuary Advisors, LLC | 10.739 | 4,90 | 407 | 14,01 | ||||
| 2026-02-17 | 13F | Signature Equity Partners, LLC | 113 | 4 | ||||||
| 2026-04-20 | 13F | MBA Advisors LLC | 5.000 | 283 | ||||||
| 2026-04-06 | 13F | GAMMA Investing LLC | 8.837 | 14,51 | 500 | 71,23 | ||||
| 2026-02-17 | 13F | Mercer Global Advisors Inc /adv | 25.924 | -0,10 | 984 | 8,50 | ||||
| 2026-02-17 | 13F | Glenmede Trust Co Na | 12.786 | 82,87 | 485 | 124,54 | ||||
| 2026-04-23 | 13F | Ewa, Llc | 3.573 | 202 | ||||||
| 2026-02-10 | 13F | KERR FINANCIAL PLANNING Corp | 100 | 0,00 | 4 | 33,33 | ||||
| 2026-04-13 | 13F | Salem Investment Counselors Inc | 155 | 9 | ||||||
| 2026-02-10 | 13F | Godfrey Financial Associates, Inc. | 4 | 0 | ||||||
| 2026-01-23 | 13F | Assetmark, Inc | 463 | -18,34 | 18 | -10,53 | ||||
| 2025-11-12 | 13F | Transce3nd, LLC | 0 | -100,00 | 0 | |||||
| 2025-11-13 | 13F | Kayne Anderson Rudnick Investment Management Llc | 0 | -100,00 | 0 | |||||
| 2026-04-08 | 13F | Arlington Trust Co LLC | 79 | 4 | ||||||
| 2026-04-17 | 13F | Roxbury Financial LLC | 30 | 0,00 | 2 | 0,00 | ||||
| 2026-04-23 | 13F | North Star Investment Management Corp. | 14 | 0,00 | 1 | |||||
| 2026-02-14 | 13F | Rockefeller Capital Management L.P. | 1.328 | -12,86 | 50 | -5,66 | ||||
| 2026-02-06 | 13F | Cullen/frost Bankers, Inc. | 47 | 0,00 | 2 | 0,00 | ||||
| 2026-02-17 | 13F | Point72 Asset Management, L.P. | 77.031 | 2.923 | ||||||
| 2026-04-14 | 13F | Nbc Securities, Inc. | 0 | -100,00 | 0 | |||||
| 2026-01-15 | 13F | Brookstone Capital Management | 0 | -100,00 | 0 | |||||
| 2026-02-13 | 13F | Charles Schwab Investment Management Inc | 146.823 | 19,32 | 5.570 | 29,53 | ||||
| 2026-04-14 | 13F | Prospera Financial Services Inc | 4.661 | 264 | ||||||
| 2026-04-22 | 13F | Bravera Wealth | 65 | -55,48 | 4 | -40,00 | ||||
| 2026-02-12 | 13F | Dimensional Fund Advisors Lp | 89.519 | 4,24 | 3.396 | 13,16 | ||||
| 2026-02-17 | 13F | Creative Planning | 155.194 | 38,34 | 5.888 | 50,20 | ||||
| 2026-02-12 | 13F | Rossby Financial, LCC | 11 | 0 | ||||||
| 2026-01-21 | 13F | Sound Income Strategies, LLC | 237 | 301,69 | 9 | 350,00 | ||||
| 2025-11-12 | 13F | NewSquare Capital LLC | 0 | -100,00 | 0 | |||||
| 2026-04-15 | 13F | FNY Investment Advisers, LLC | 5.800 | 0 | ||||||
| 2025-11-13 | 13F | Promus Capital, LLC | 50 | 0,00 | 2 | 0,00 | ||||
| 2026-02-12 | 13F | Callan Family Office, LLC | 79.179 | 53,01 | 3.004 | 66,15 | ||||
| 2026-02-12 | 13F | Wealthspire Advisors, LLC | 0 | -100,00 | 0 | |||||
| 2026-02-13 | 13F | Mariner, LLC | 106.717 | 14,23 | 4.050 | 24,01 | ||||
| 2026-04-22 | 13F | Traveka Wealth, LLC | 4.485 | 254 | ||||||
| 2026-02-02 | 13F | Ativo Capital Management LLC | 42.509 | -5,98 | 1.613 | 2,03 | ||||
| 2026-02-13 | 13F | Kestra Advisory Services, LLC | 0 | -100,00 | 0 | |||||
| 2026-02-17 | 13F | Private Advisor Group, LLC | 9.223 | 1,11 | 350 | 9,75 | ||||
| 2026-02-06 | 13F | Larson Financial Group LLC | 1.452 | 4,69 | 55 | 14,58 | ||||
| 2026-02-03 | 13F | We Are One Seven, LLC | 11.882 | 2,26 | 451 | 10,84 | ||||
| 2026-02-10 | 13F | CIBC World Markets Inc. | 128.575 | -2,86 | 4.878 | 5,45 | ||||
| 2025-11-07 | 13F | Sierra Ocean, Llc | 0 | -100,00 | 0 | |||||
| 2026-01-29 | 13F | UBS Group AG | 235.346 | 3,56 | 8.929 | 12,43 | ||||
| 2026-02-17 | 13F | Aqr Capital Management Llc | 47.312 | 41,70 | 1.795 | 53,95 | ||||
| 2026-01-30 | 13F/A | M&t Bank Corp | 7.343 | 9,04 | 279 | 18,30 | ||||
| 2026-02-11 | 13F | Capital Wealth Planning, LLC | 306.408 | 109,75 | 11.962 | 134,32 | ||||
| 2026-01-16 | 13F | Crewe Advisors LLC | 90 | 0,00 | 3 | 0,00 | ||||
| 2026-02-12 | 13F | Integrated Quantitative Investments LLC | 0 | -100,00 | 0 | |||||
| 2026-04-21 | 13F | Aaron Wealth Advisors LLC | 16.224 | 21,67 | 918 | 81,78 | ||||
| 2026-02-17 | 13F | Raymond James Financial Inc | 533.888 | -1,32 | 20.256 | 7,12 | ||||
| 2026-02-12 | 13F | Brinker Capital Investments, LLC | 83.593 | 5,30 | 3.172 | 14,31 | ||||
| 2026-02-05 | 13F | May Hill Capital, LLC | 6.468 | 245 | ||||||
| 2026-02-12 | 13F | CIBC Private Wealth Group, LLC | 1.000 | -27,22 | 38 | -22,92 | ||||
| 2026-04-21 | 13F | Old National Bancorp /in/ | 4.008 | 227 | ||||||
| 2026-04-17 | 13F | AdvisorNet Financial, Inc | 110 | 0,00 | 6 | 50,00 | ||||
| 2026-01-30 | 13F | Us Bancorp \de\ | 44.599 | 2,59 | 1.692 | 11,39 | ||||
| 2026-02-06 | 13F | Harvest Portfolios Group Inc. | 51.172 | -2,83 | 1.941 | 5,49 | ||||
| 2026-04-07 | 13F | Park Avenue Securities Llc | 14.187 | 40,93 | 1 | |||||
| 2026-02-03 | 13F | Crossmark Global Holdings, Inc. | 74.370 | -16,28 | 2.822 | -9,12 | ||||
| 2026-04-17 | 13F | HHM Wealth Advisors, LLC | 62 | 0,00 | 4 | 50,00 | ||||
| 2025-10-31 | 13F | Sagespring Wealth Partners, Llc | 0 | -100,00 | 0 | -100,00 | ||||
| 2026-04-07 | 13F | Signaturefd, Llc | 28.681 | 0,77 | 1.624 | 50,42 | ||||
| 2026-02-09 | 13F | Bleakley Financial Group, LLC | 28.705 | 8,31 | 1.089 | 17,60 | ||||
| 2026-02-12 | 13F | Principal Securities, Inc. | 0 | -100,00 | 0 | -100,00 | ||||
| 2026-02-13 | 13F | Gts Securities Llc | 6.091 | 231 | ||||||
| 2026-02-12 | 13F | Steward Partners Investment Advisory, Llc | 3.880 | -0,82 | 147 | 8,09 | ||||
| 2026-02-12 | 13F | Triumph Capital Management | 38 | 0,00 | 1 | 0,00 | ||||
| 2026-02-13 | 13F | Ieq Capital, Llc | 18.791 | 11,63 | 713 | 21,09 | ||||
| 2026-04-13 | 13F | True Wealth Design, LLC | 444 | 15,32 | 25 | 78,57 | ||||
| 2026-04-20 | 13F | MBM Wealth Consultants, LLC | 47 | 3 | ||||||
| 2026-02-18 | 13F | EP Wealth Advisors, Inc. | 7.247 | 275 | ||||||
| 2026-04-22 | 13F | Viewpoint Investment Partners Corp | 5.600 | -28,21 | 232 | -21,36 | ||||
| 2026-02-02 | 13F | Advisors Preferred, LLC | 21.112 | -59,55 | 824 | -54,95 | ||||
| 2026-02-17 | 13F | Mpwm Advisory Solutions, Llc | 0 | -100,00 | 0 | |||||
| 2026-02-17 | 13F | Cape Investment Advisory, Inc. | 2.500 | 95 | ||||||
| 2026-02-12 | 13F | Skopos Labs, Inc. | 30.701 | 277,30 | 1.159 | 338,64 | ||||
| 2026-04-23 | 13F | Forum Financial Management, LP | 0 | -100,00 | 0 | |||||
| 2026-01-14 | 13F | Spire Wealth Management | 0 | -100,00 | 0 | -100,00 | ||||
| 2026-01-30 | 13F | R Squared Ltd | 12.114 | 53,95 | 460 | 66,91 | ||||
| 2026-02-23 | 13F | Blue Capital, Inc. | 0 | -100,00 | 0 | |||||
| 2026-02-03 | 13F | Ballentine Partners, LLC | 8.607 | -21,68 | 327 | -15,10 | ||||
| 2026-02-13 | 13F | Stifel Financial Corp | 45.132 | -18,13 | 1.712 | -11,11 | ||||
| 2026-02-13 | 13F | Kilter Group LLC | 2 | 0 | ||||||
| 2026-02-12 | 13F | Benson Wealth Management INC | 124 | 5 | ||||||
| 2026-02-13 | 13F | Rhumbline Advisers | 13.133 | 183,22 | 498 | 207,41 | ||||
| 2026-02-13 | 13F | Ubs Asset Management Americas Inc | 3.733 | 142 | ||||||
| 2026-02-23 | 13F | Mv Capital Management, Inc. | 16 | 1 | ||||||
| 2026-02-10 | 13F | Bnp Paribas Arbitrage, Sa | 39 | -98,80 | 1 | -99,12 | ||||
| 2026-02-13 | 13F | Smartleaf Asset Management LLC | 7.783 | 26,57 | 297 | 36,41 | ||||
| 2026-02-17 | 13F | Arosa Capital Management LP | 110.000 | 4.173 | ||||||
| 2026-04-13 | 13F | Fractal Investments LLC | 9.186 | 520 | ||||||
| 2026-01-14 | 13F | Hennion & Walsh Asset Management, Inc. | 8.894 | 337 | ||||||
| 2026-01-21 | 13F | Newbridge Financial Services Group, Inc. | 26.640 | 408,40 | 1.011 | 451,91 | ||||
| 2026-04-21 | 13F | SmartHarvest Portfolios, LLC | 5.673 | -10,65 | 321 | 33,75 | ||||
| 2026-02-10 | 13F | Goldman Sachs Group Inc | 1.353.911 | 2,94 | 51.367 | 11,75 | ||||
| 2026-02-10 | 13F | Rothschild Investment Llc | 501 | 2,45 | 19 | 11,76 | ||||
| 2026-02-05 | 13F | Bessemer Group Inc | 4.485 | -24,03 | 0 | |||||
| 2025-11-12 | 13F | Park Square Financial Group, LLC | 0 | -100,00 | 0 | |||||
| 2026-02-17 | 13F | Northern Trust Corp | 917.461 | -0,94 | 34.808 | 7,53 | ||||
| 2026-02-13 | 13F | MAI Capital Management | 120 | -23,57 | 5 | -20,00 | ||||
| 2026-04-07 | 13F | Farther Finance Advisors, LLC | 22.255 | 14,91 | 1.221 | 66,35 | ||||
| 2026-04-21 | 13F | Financial Consulate, Inc | 174 | 39,20 | 10 | 125,00 | ||||
| 2026-02-03 | 13F | Gallacher Capital Management LLC | 21.102 | -0,05 | 801 | 8,55 | ||||
| 2026-02-17 | 13F | Fmr Llc | 628.662 | -4,64 | 23.851 | 3,52 | ||||
| 2026-04-24 | 13F | UMA Financial Services, Inc. | 71 | -23,66 | 4 | 33,33 | ||||
| 2026-02-09 | 13F | Key FInancial Inc | 0 | -100,00 | 0 | |||||
| 2026-04-22 | 13F | Motco | 0 | -100,00 | 0 | |||||
| 2026-01-07 | 13F | Aventura Private Wealth, LLC | 315 | 0,00 | 12 | 0,00 | ||||
| 2026-02-13 | 13F | National Bank Of Canada /fi/ | 4.766 | 39.616,67 | 181 | |||||
| 2026-02-13 | 13F | SRS Capital Advisors, Inc. | 3.726 | 32,17 | 141 | 43,88 | ||||
| 2026-04-23 | 13F | CWM Advisors, LLC | 7.645 | -3,97 | 433 | 43,05 | ||||
| 2026-02-12 | 13F | Quadrant Capital Group Llc | 24.104 | 2,46 | 915 | 11,19 | ||||
| 2026-02-17 | 13F | Safe Harbor Fiduciary, LLC | 300 | 0,00 | 11 | 22,22 | ||||
| 2026-01-27 | 13F | Evergreen Capital Management Llc | 29.425 | 3,79 | 1.116 | 10,82 | ||||
| 2026-04-13 | 13F | Creative Financial Designs Inc /adv | 46 | 0,00 | 3 | 100,00 | ||||
| 2026-04-13 | 13F | Trust Co | 9 | 0,00 | 1 | |||||
| 2026-01-20 | 13F | Cromwell Holdings LLC | 2.795 | 0,00 | 106 | 7,07 | ||||
| 2026-02-11 | 13F | SOUTH STATE Corp | 53 | 0,00 | 2 | 100,00 | ||||
| 2025-11-13 | 13F | Glenmede Investment Management, LP | 11.650 | -11,28 | 407 | -4,24 | ||||
| 2026-01-23 | 13F | Carnegie Capital Asset Management, LLC | 8.945 | 2,29 | 339 | 11,15 | ||||
| 2026-03-04 | 13F | Rehmann Capital Advisory Group | 13.805 | -0,30 | 524 | 8,28 | ||||
| 2026-02-09 | 13F | Huntington National Bank | 27 | 1 | ||||||
| 2025-11-14 | 13F | Strategic Wealth Partners, Ltd. | 291 | 10 | ||||||
| 2026-04-22 | 13F | Stone House Investment Management, LLC | 220 | 83,33 | 12 | 200,00 | ||||
| 2026-01-28 | 13F | CAPROCK Group, Inc. | 31.644 | 17,75 | 1.201 | 24,87 | ||||
| 2026-02-13 | 13F | Morgan Stanley | 3.019.566 | 0,56 | 114.562 | 9,16 | ||||
| 2026-02-17 | 13F | Millennium Management Llc | 161.359 | -15,20 | 6.122 | -7,95 | ||||
| 2026-04-24 | 13F | Keybank National Association/oh | 7.748 | 439 | ||||||
| 2026-02-06 | 13F | Lsv Asset Management | 35.900 | 0,00 | 1 | 0,00 | ||||
| 2026-02-13 | 13F | Van Eck Associates Corp | 30.462 | 15,99 | 1 | |||||
| 2026-04-13 | 13F | Nvest Wealth Strategies, Inc. | 13 | 1 | ||||||
| 2026-04-14 | 13F | Drive Wealth Management, Llc | 5.687 | 1,05 | 325 | 52,58 | ||||
| 2026-04-14 | 13F | RD Lewis Holdings, Inc. | 73.932 | -1,40 | 4.117 | 32,13 | ||||
| 2026-02-10 | 13F | Sivia Capital Partners, LLC | 6.212 | 236 | ||||||
| 2026-02-17 | 13F | Cetera Investment Advisers | 20.894 | 33,52 | 793 | 45,05 | ||||
| 2026-04-21 | 13F | Vise Technologies, Inc. | 14.315 | 0,00 | 543 | 0,00 | ||||
| 2026-02-13 | 13F | JustInvest LLC | 80.169 | -2,13 | 3.042 | 6,25 | ||||
| 2026-04-22 | 13F | Janney Montgomery Scott LLC | 23.313 | 185,87 | 1 | |||||
| 2026-02-12 | 13F | Jane Street Group, Llc | 12.152 | 461 | ||||||
| 2026-03-04 | 13F | SHP Wealth Management | 86 | 3 | ||||||
| 2026-04-15 | 13F | Redhawk Wealth Advisors, Inc. | 22.835 | -6,16 | 1.293 | 39,98 | ||||
| 2026-01-20 | 13F | Ascent Group, LLC | 5.717 | 217 | ||||||
| 2026-02-06 | 13F | HighTower Advisors, LLC | 21.893 | 9,77 | 831 | 19,08 | ||||
| 2026-02-17 | 13F | SageView Advisory Group, LLC | 299 | 11 | ||||||
| 2026-02-17 | 13F | Wiley Bros.-aintree Capital, Llc | 11.663 | 3,47 | 442 | 12,47 | ||||
| 2026-02-12 | 13F | Mount Yale Investment Advisors, LLC | 0 | -100,00 | 0 | -100,00 | ||||
| 2026-02-11 | 13F | Franklin Resources Inc | 6.139 | 233 | ||||||
| 2026-04-20 | 13F | Jfs Wealth Advisors, Llc | 546 | -45,94 | 31 | -21,05 | ||||
| 2026-01-23 | 13F | Cambiar Investors Llc | 17.340 | -30,96 | 658 | -25,09 | ||||
| 2025-10-30 | 13F | Twin Peaks Wealth Advisors, LLC | 0 | -100,00 | 0 | |||||
| 2026-02-10 | 13F | Bruce G. Allen Investments, LLC | 355 | 0,00 | 13 | 8,33 | ||||
| 2026-02-17 | 13F | Jones Financial Companies Lllp | 11.245 | 18,97 | 427 | 26,41 | ||||
| 2026-02-11 | 13F | Flagship Wealth Advisors, Llc | 29 | 0,00 | 1 | 0,00 | ||||
| 2026-01-30 | 13F | Carrera Capital Advisors | 5.430 | 206 | ||||||
| 2026-02-13 | 13F | GQG Partners LLC | 175.726 | 24,36 | 6.667 | 35,01 | ||||
| 2026-02-17 | 13F | United Capital Financial Advisers, Llc | 107.783 | 1.387,69 | 4.089 | 1.516,21 | ||||
| 2026-02-09 | 13F | Hantz Financial Services, Inc. | 47.601 | -16,04 | 2 | 0,00 | ||||
| 2026-04-20 | 13F | Ronald Blue Trust, Inc. | 11.605 | -26,72 | 657 | 9,33 | ||||
| 2026-02-04 | 13F | Boyd Watterson Asset Management Llc/oh | 258 | 0,00 | 10 | 0,00 | ||||
| 2026-02-09 | 13F | Fisher Asset Management, LLC | 152.608 | -0,70 | 5.790 | 7,78 | ||||
| 2026-02-13 | 13F | Colony Group, LLC | 19.972 | 99,50 | 758 | 20,16 | ||||
| 2026-02-13 | 13F | Golden State Wealth Management, LLC | 607 | 1,00 | 23 | 9,52 | ||||
| 2026-02-12 | 13F | Beacon Capital Management, Inc. | 1 | 0,00 | 0 | |||||
| 2025-11-14 | 13F | Wetherby Asset Management Inc | 15.762 | 0,24 | 551 | 8,06 | ||||
| 2026-02-11 | 13F | Zions Bancorporation, National Association /ut/ | 115 | 0,00 | 4 | 0,00 | ||||
| 2026-04-23 | 13F | Oppenheimer Asset Management Inc. | 0 | -100,00 | 0 | |||||
| 2026-02-10 | 13F | Envestnet Asset Management Inc | 139.519 | -8,50 | 5.293 | -0,68 | ||||
| 2026-04-15 | 13F | Merit Financial Group, LLC | 5.564 | 315 | ||||||
| 2026-01-29 | 13F | DecisionPoint Financial, LLC | 67 | 0,00 | 3 | 0,00 | ||||
| 2026-02-17 | 13F | New Vernon Capital Holdings II LLC | 12.197 | 463 | ||||||
| 2026-04-08 | 13F | Legacy Wealth Asset Management, LLC | 23.861 | 16,15 | 1.351 | 73,30 | ||||
| 2026-02-05 | 13F | Cambridge Investment Research Advisors, Inc. | 7.197 | 19,23 | 0 | |||||
| 2026-01-29 | 13F | Dunhill Financial, LLC | 250 | 0,00 | 9 | 12,50 | ||||
| 2025-11-13 | 13F | Total Investment Management Inc | 0 | -100,00 | 0 | |||||
| 2026-01-15 | 13F | Allspring Global Investments Holdings, LLC | 10.717 | 23,23 | 419 | 38,74 | ||||
| 2026-02-11 | 13F | Manchester Capital Management LLC | 1.206 | 46 | ||||||
| 2026-04-03 | 13F | Investors Research Corp | 0 | -100,00 | 0 | |||||
| 2026-01-26 | 13F | Private Trust Co Na | 229 | 0,00 | 9 | 0,00 | ||||
| 2026-02-13 | 13F | 1832 Asset Management L.P. | 71.900 | 2.728 | ||||||
| 2026-01-22 | 13F | Massachusetts Financial Services Co /ma/ | 589.265 | 8,19 | 22.357 | 17,44 | ||||
| 2026-02-06 | 13F | Envestnet Portfolio Solutions, Inc. | 7.481 | 14,92 | 284 | 24,67 | ||||
| 2026-04-15 | 13F | DAVENPORT & Co LLC | 9.187 | -16,75 | 520 | 24,40 | ||||
| 2026-02-11 | 13F | Group One Trading, L.p. | Put | 0 | -100,00 | 0 | -100,00 | |||
| 2026-02-11 | 13F | Cerity Partners LLC | 32.101 | 7,75 | 1.218 | 16,91 | ||||
| 2026-04-09 | 13F | Park Place Capital Corp | 69 | 0,00 | 4 | 50,00 | ||||
| 2026-04-21 | 13F | PDS Planning, Inc | 6.359 | 0,00 | 360 | 48,96 | ||||
| 2026-02-13 | 13F | Glen Eagle Advisors, LLC | 6.330 | 16,79 | 240 | 26,98 | ||||
| 2026-04-22 | 13F | Pinnacle Bancorp, Inc. | 0 | -100,00 | 0 | |||||
| 2026-04-24 | 13F | Yousif Capital Management, Llc | 28.181 | 0,00 | 1.595 | 48,10 | ||||
| 2026-04-20 | 13F | Ritholtz Wealth Management | 47.441 | 39,63 | 2.686 | 108,30 | ||||
| 2026-02-13 | 13F | Pinnacle Wealth Planning Services, Inc. | 1.552 | 59 | ||||||
| 2026-01-12 | 13F | CVA Family Office, LLC | 37 | 0,00 | 1 | 0,00 | ||||
| 2026-01-21 | 13F | Greenleaf Trust | 12.689 | 1,90 | 481 | 10,57 | ||||
| 2026-02-09 | 13F | Coldstream Capital Management Inc | 8.740 | 18,41 | 332 | 28,79 | ||||
| 2026-02-18 | 13F | Vident Advisory, LLC | 35.936 | -5,35 | 1.363 | 2,79 | ||||
| 2026-04-10 | 13F | Abound Wealth Management | 8 | 0,00 | 0 | |||||
| 2026-01-27 | 13F | Checchi Capital Advisers, LLC | 10.858 | -1,02 | 412 | 7,31 | ||||
| 2026-02-13 | 13F | American Century Companies Inc | 721.064 | 13,22 | 27.357 | 22,90 | ||||
| 2026-04-20 | 13F | LVW Advisors, LLC | 11.705 | 663 | ||||||
| 2026-02-06 | 13F | Addison Advisors LLC | 1.691 | 0,00 | 64 | 8,47 | ||||
| 2026-04-06 | 13F | Highline Wealth Partners Llc | 7 | 0,00 | 0 | |||||
| 2026-01-16 | 13F | First Pacific Financial | 0 | -100,00 | 0 | |||||
| 2026-02-12 | 13F | Bank Of Montreal /can/ | 16.982 | -10,10 | 644 | -2,42 | ||||
| 2026-01-20 | 13F | Independence Bank of Kentucky | 50 | 2 | ||||||
| 2026-01-26 | 13F | Cwm, Llc | 6.256 | 5,75 | 0 | |||||
| 2026-04-21 | 13F | Nemes Rush Group LLC | 70 | 536,36 | 4 | |||||
| 2026-02-11 | 13F | LPL Financial LLC | 107.406 | 8,37 | 4.075 | 17,64 | ||||
| 2025-11-06 | 13F | Abc Arbitrage Sa | 0 | -100,00 | 0 | |||||
| 2026-02-05 | 13F | Allworth Financial LP | 2.197 | -26,03 | 83 | -19,42 | ||||
| 2026-02-13 | 13F | Cornerstone Financial Management LLC | 90 | 3 | ||||||
| 2026-02-13 | 13F | Inspire Advisors, LLC | 16.307 | -3,54 | 619 | 4,75 | ||||
| 2026-02-12 | 13F | BlackRock, Inc. | 1.160.814 | 7,84 | 44.041 | 17,06 | ||||
| 2026-02-09 | 13F | Harbour Investments, Inc. | 0 | -100,00 | 0 | |||||
| 2026-02-11 | 13F | GW&K Investment Management, LLC | 131 | 0 | ||||||
| 2026-02-17 | 13F | Bank Of America Corp /de/ | 880.628 | -0,40 | 33.411 | 8,12 | ||||
| 2025-11-12 | 13F | Cresset Asset Management, LLC | 0 | -100,00 | 0 | |||||
| 2026-02-13 | 13F | Umb Bank N A/mo | 111 | 0,00 | 4 | 33,33 | ||||
| 2026-04-21 | 13F | Pinnacle Associates Ltd | 4.509 | 255 | ||||||
| 2026-02-03 | 13F | Canal Insurance CO | 10.000 | 0,00 | 0 | |||||
| 2026-02-10 | 13F | Connor, Clark & Lunn Investment Management Ltd. | 0 | -100,00 | 0 | |||||
| 2026-02-02 | 13F | Fifth Third Bancorp | 580 | 442,06 | 22 | 633,33 | ||||
| 2026-02-11 | 13F | Syon Capital Llc | 15.647 | 594 | ||||||
| 2026-04-06 | 13F | Rosenberg Matthew Hamilton | 1.871 | 0,00 | 106 | 50,00 | ||||
| 2026-02-10 | 13F | Natixis Advisors, L.p. | 3.279.164 | 5,31 | 124 | 14,81 | ||||
| 2026-02-12 | 13F | BRYN MAWR TRUST Co | 0 | -100,00 | 0 | -100,00 | ||||
| 2026-02-11 | 13F | Brandes Investment Partners, Lp | 410.556 | -44,25 | 15.577 | -39,48 | ||||
| 2026-02-04 | 13F | LRI Investments, LLC | 57 | 0,00 | 2 | 100,00 | ||||
| 2026-02-03 | 13F | Manning & Napier Advisors Llc | 112.041 | -1,58 | 4.271 | 5,95 | ||||
| 2026-02-12 | 13F | New York State Common Retirement Fund | 0 | -100,00 | 0 | -100,00 | ||||
| 2026-04-13 | 13F | Mather Group, Llc. | 172 | 10 | ||||||
| 2026-02-13 | 13F | Mml Investors Services, Llc | 22.577 | 20,59 | 857 | 30,89 | ||||
| 2026-01-28 | 13F | Salomon & Ludwin, LLC | 587 | 57,80 | 23 | 76,92 | ||||
| 2026-02-13 | 13F | Transamerica Financial Advisors, Inc. | 136 | 5 | ||||||
| 2026-04-15 | 13F | Nations Financial Group Inc, /ia/ /adv | 10.075 | -0,85 | 570 | 48,05 | ||||
| 2026-02-19 | 13F | CI Private Wealth, LLC | 91.943 | 73,85 | 2.050 | 10,93 | ||||
| 2026-01-13 | 13F | Kathmere Capital Management, LLC | 11.062 | 31,96 | 420 | 43,49 | ||||
| 2025-11-19 | 13F | Sunbelt Securities, Inc. | 0 | -100,00 | 0 | |||||
| 2026-02-10 | 13F/A | Northwestern Mutual Wealth Management Co | 623 | 13,27 | 24 | 21,05 | ||||
| 2026-02-13 | 13F | First Trust Advisors Lp | 18.389 | 11,87 | 698 | 21,43 | ||||
| 2026-02-17 | 13F | Ameriprise Financial Inc | 39.306 | 24,66 | 1.491 | 34,08 | ||||
| 2025-11-06 | 13F | Ameritas Advisory Services, LLC | 0 | -100,00 | 0 | -100,00 | ||||
| 2026-02-02 | 13F | Qrg Capital Management, Inc. | 98.297 | 23,04 | 3.729 | 33,56 | ||||
| 2026-02-05 | 13F | Td Private Client Wealth Llc | 947 | 14,79 | 36 | 25,00 | ||||
| 2026-04-08 | 13F | Wealth Enhancement Advisory Services, Llc | 8.170 | 7,15 | 466 | 61,81 | ||||
| 2026-02-13 | 13F | Centiva Capital, LP | 5.963 | 226 | ||||||
| 2026-02-17 | 13F | Optiver Holding B.V. | 0 | -100,00 | 0 | |||||
| 2026-04-16 | 13F | Toth Financial Advisory Corp | 110 | 0,00 | 6 | 50,00 | ||||
| 2026-02-02 | 13F | Truist Financial Corp | 6.400 | 243 |